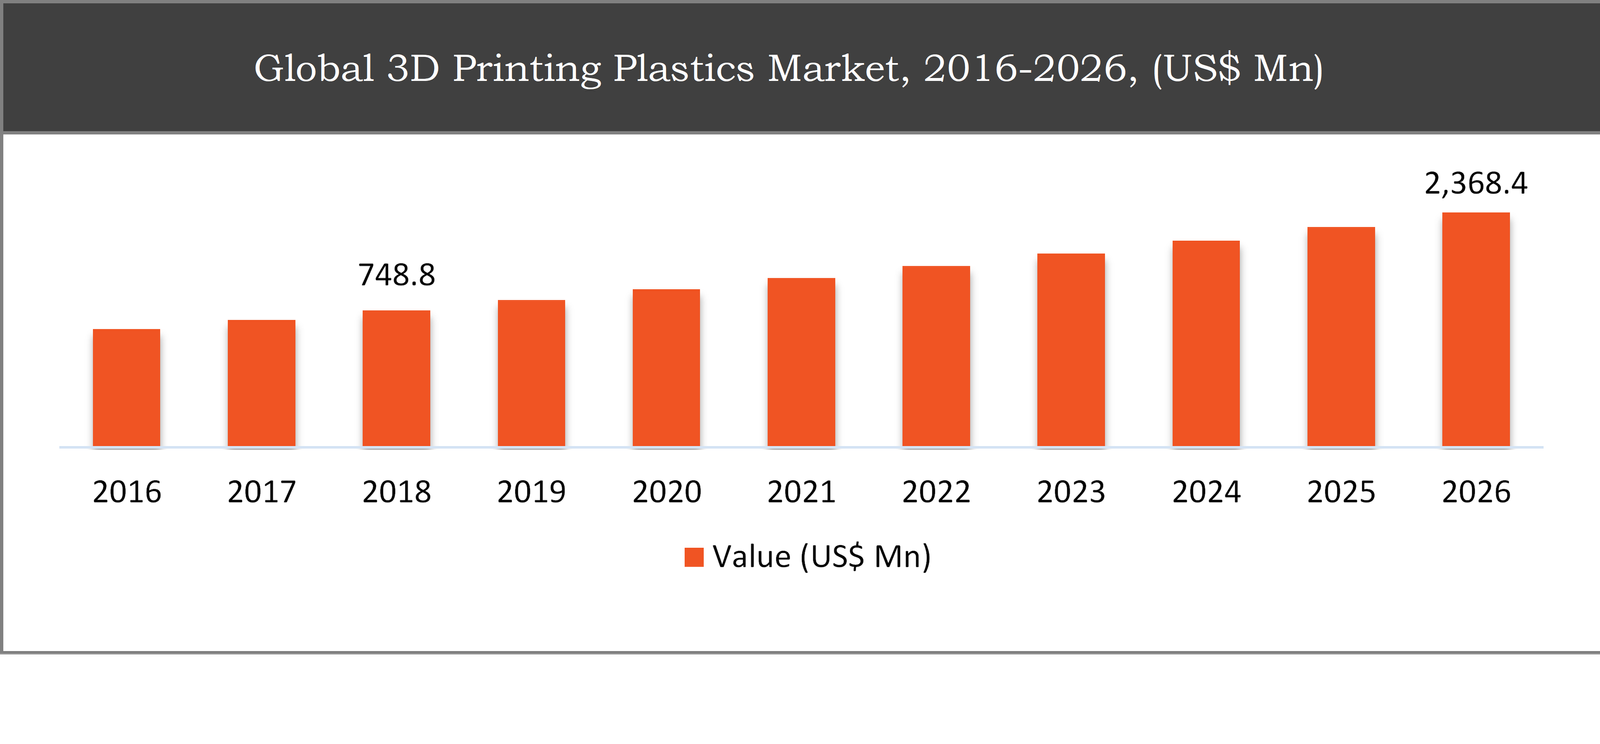
The global 3D printing plastics market was valued at USD 748.8 million in 2018 and is expected to contribute USD 2,368.4 million in 2026, growing at a cumulative annual growth rate of 16.4% during the forecast period.
3D printing of plastics is an effective method and widely used for the production of components and parts in various sectors such as automotive, consumer electronics and pharmaceuticals. ABS and PLA are commonly used materials in 3D printing of plastics. Considering the current scenario, the consumer goods are emerging significantly in the implementation of 3D plastic products in order to minimize the lead time provided by additive manufacturing techniques.
The development of the 3D printing plastics market is motivated mainly by increasing demand from the automotive and aerospace industries, the latest developments in the additive manufacturing sector and favourable public support. In addition, the increasing adoption of 3d bio-based printing grades across developed countries is anticipated to generate possibilities for producers in the worldwide market over the forecast period. The industry benefits mainly from favourable public assistance in developing nations such as China, India, and Mexico. In addition, 3D printed products make a significant contribution to achieving economies of scale through the use of less lead time, decreased costs and mitigated hazards. This expected to lead the demand and sales of 3D printing plastics and further create opportunities in the global market in the coming years.
However, the high costs associated with the manufacturing of the 3d printed products are expected to hinder the growth of the global 3D printing plastics market.
|
By Product |
|
|
By Form |
|
|
By Application |
|
|
By Region |
|
The photopolymer type segment is expected to lead the global 3D printing plastics market throughout the forecast period
Based on product, the market has been categorized into photopolymer, polylactic acid (PLA), ABS, polyamide, and others. The photopolymer type segment is expected to hold approximately 27% share in the global 3D printing plastics market in 2018 owing to photopolymer includes most of the polymer grades in resin form.
Based on the form, the filament segment is expected to grow at a CAGR of around 18% throughout the forecast period
By form, the market has been bifurcated into filament, powder, and liquid/ink. The filament form for 3D printing plastics segment are expected to held for the largest share in the market and are expected to grow at a CAGR of around 18% during the forecast period owing to wide use across general and commercial applications. Furthermore, the powder form segment accounts for the highest CAGR in the global 3D printing plastics market owing to the increase in demand and sales for laser sintering technology.
Based on the application, the healthcare segment is expected to dominant the market during the forecast period
Based on application, the market has been segmented into healthcare, automotive, aerospace & defense, electrical & electronics, and others. The healthcare application segment accounts of the largest share in the global 3D printing plastics market by application. The major factors that are driving the growth of this segment are wide adoption across orthopedic implants, prosthetics, dentals and others.
Global 3D Printing Plastics Market, 2016-2026, (US$ Mn)

North America to dominate the 3D printing plastics market throughout the forecast period
North America accounted for nearly 37% share of the global 3D printing plastics market in 2018 and is expected to dominate the market throughout the forecast period owing to increase in government spending across aerospace & defense and healthcare industries, which are accounted for widely adopted of 3D printing plastics technologies. However, the increased awareness regarding environmental concern due to the use of plastics is the major concern in the developed regions, worldwide.
Asia-Pacific is anticipated to maintain the largest CAGR on the worldwide market due to the strong presence of end-use sectors for 3D printing materials, such as the electrical & electronics industries, healthcare and, automotive which are among the fastest to adopt 3D printing technology in the globe.
Company Profiles and Competitive Intelligence:
The major players operating in the global 3D printing plastics market are 3D Systems Corporation, Stratasys, Ltd., Arkema SA, BASF SE, Evonik Industries AG, SABIC, HP Inc., DowDuPont Inc., CRP Group, and Envisiontec GmbH, among others.

Ask for free product review call with the author

Share your specific research requirements for a customized report

Request for due diligence and consumer centric studies

Request for study updates, segment specific and country level reports
TABLE OF CONTENTS
Chapter 1 Executive Summary
1.1. Market Summary
1.1.1. Global 3D Printing Plastics Market, 2016-2026, (USD Million)
1.2. Market Snapshot: Global 3D Printing Plastics Market
1.3. Market Dynamics
1.4. Global 3D Printing Plastics Market, by Segment, 2018
1.4.1. Global 3D Printing Plastics Market, by Type, 2018, (USD Million)
1.4.2. Global 3D Printing Plastics Market, by Form, 2018, (USD Million)
1.4.3. Global 3D Printing Plastics Market, by Application, 2018, (USD Million)
1.4.4. Global 3D Printing Plastics Market, by Region, 2018 (USD Million)
1.5. Premium Insights
1.5.1. 3D Printing Plastics Market In Developed Vs. Developing Economies, 2018 vs 2026
1.5.2. Global 3D Printing Plastics Market: Regional Life Cycle Analysis
Chapter 2 Market Dynamics
2.1. Market Overview
2.2. Market Drivers
2.2.1. Growing demand from automotive and aerospace industries
2.2.2. Recent developments in the additive manufacturing industry
2.2.3. Favorable government support
2.3. Market Restraints
2.3.1. High costs of the 3d printed products
2.4. Market Opportunities
2.4.1. Rising adoption of 3d printing bio-based grades
2.5. Industry Value Chain Analysis
2.6. Pricing Analysis
2.7. Porter’s Five Forces Analysis
Chapter 3 Global 3D Printing Plastics Market, by Type
3.1. Market Overview, by Type
3.1.1. Global 3D Printing Plastics Market, by Type, 2016-2026 (USD Million)
3.1.2. Incremental Opportunity, by Type, 2018
3.2. Photopolymer
3.2.1. Global 3D Printing Plastics Market, by Photopolymer, 2016-2026, (USD Million)
3.3. ABS
3.3.1. Global 3D Printing Plastics Market, by ABS, 2016-2026, (USD Million)
3.4. Polyamide
3.4.1. Global 3D Printing Plastics Market, by Polyamide, 2016-2026, (USD Million)
3.5. Polylactic Acid (PLA)
3.5.1. Global 3D Printing Plastics Market, by Polylactic Acid (PLA), 2016-2026, (USD Million)
3.6. Others
3.6.1. Global 3D Printing Plastics Market, by Others, 2016-2026, (USD Million)
Chapter 4 Global 3D Printing Plastics Market, by Form
4.1. Market Overview, by Form
4.1.1. Global 3D Printing Plastics Market, by Form, 2016-2026 (USD Million)
4.1.2. Incremental Opportunity, by Form, 2018
4.2. Filament
4.2.1. Global 3D Printing Plastics Market, by Filament, 2016-2026, (USD Million)
4.3. Liquid/Ink
4.3.1. Global 3D Printing Plastics Market, by Liquid/Ink, 2016-2026, (USD Million)
4.4. Powder
4.4.1. Global 3D Printing Plastics Market, by Powder, 2016-2026, (USD Million)
Chapter 5 Global 3D Printing Plastics Market, by Application
5.1. Market Overview, by Application
5.1.1. Global 3D Printing Plastics Market, by Application, 2016-2026 (USD Million)
5.1.2. Incremental Opportunity, by Application, 2018
5.2. Healthcare
5.2.1. Global 3D Printing Plastics Market, by Healthcare, 2016-2026, (USD Million)
5.3. Aerospace & Defense
5.3.1. Global 3D Printing Plastics Market, by Aerospace & Defense, 2016-2026, (USD Million)
5.4. Automotive
5.4.1. Global 3D Printing Plastics Market, by Automotive, 2016-2026, (USD Million)
5.5. Electrical & Electronics
5.5.1. Global 3D Printing Plastics Market, by Electrical & Electronics, 2016-2026, (USD Million)
5.6. Others
5.6.1. Global 3D Printing Plastics Market, by Others, 2016-2026, (USD Million)
Chapter 6 Global 3D Printing Plastics Market, by Region
6.1. Market Overview, by Region
6.1.1. Global 3D Printing Plastics Market, by Region, 2016-2026, (USD Million)
6.2. Attractive Investment Opportunity, by Region, 2018
6.3. North America 3D Printing Plastics Market
6.3.1. North America 3D Printing Plastics Market, by Country, 2016-2026 (USD Million)
6.3.2. North America 3D Printing Plastics Market, by Type, 2016-2026 (USD Million)
6.3.3. North America 3D Printing Plastics Market, by Form, 2016-2026 (USD Million)
6.3.4. North America 3D Printing Plastics Market, by Application, 2016-2026 (USD Million)
6.3.5. United States 3D Printing Plastics Market, 2016-2026 (USD Million)
6.3.6. Canada 3D Printing Plastics Market, 2016-2026 (USD Million)
6.4. Europe 3D Printing Plastics Market
6.4.1. Europe 3D Printing Plastics Market, by Country, 2016-2026 (USD Million)
6.4.2. Europe 3D Printing Plastics Market, by Type, 2016-2026 (USD Million)
6.4.3. Europe 3D Printing Plastics Market, by Form, 2016-2026 (USD Million)
6.4.4. Europe 3D Printing Plastics Market, by Application, 2016-2026 (USD Million)
6.4.5. United Kingdom 3D Printing Plastics Market, 2016-2026 (USD Million)
6.4.6. Germany 3D Printing Plastics Market, 2016-2026 (USD Million)
6.4.7. France 3D Printing Plastics Market, 2016-2026 (USD Million)
6.4.8. Rest of Europe 3D Printing Plastics Market, 2016-2026 (USD Million)
6.5. Asia Pacific 3D Printing Plastics Market
6.5.1. Asia Pacific 3D Printing Plastics Market, by Country, 2016-2026 (USD Million)
6.5.2. Asia Pacific 3D Printing Plastics Market, by Type, 2016-2026 (USD Million)
6.5.3. Asia Pacific 3D Printing Plastics Market, by Form, 2016-2026 (USD Million)
6.5.4. Asia Pacific 3D Printing Plastics Market, by Application, 2016-2026 (USD Million)
6.5.5. China 3D Printing Plastics Market, 2016-2026 (USD Million)
6.5.6. Japan 3D Printing Plastics Market, 2016-2026 (USD Million)
6.5.7. India 3D Printing Plastics Market, 2016-2026 (USD Million)
6.5.8. Rest of Asia Pacific 3D Printing Plastics Market, 2016-2026 (USD Million)
6.6. Latin America 3D Printing Plastics Market
6.6.1. Latin America 3D Printing Plastics Market, by Country, 2016-2026 (USD Million)
6.6.2. Latin America 3D Printing Plastics Market, by Type, 2016-2026 (USD Million)
6.6.3. Latin America 3D Printing Plastics Market, by Form, 2016-2026 (USD Million)
6.6.4. Latin America 3D Printing Plastics Market, by Application, 2016-2026 (USD Million)
6.6.5. Brazil 3D Printing Plastics Market, 2016-2026 (USD Million)
6.6.6. Mexico 3D Printing Plastics Market, 2016-2026 (USD Million)
6.6.7. Rest of Latin America 3D Printing Plastics Market, 2016-2026 (USD Million)
6.7. Middle East & Africa 3D Printing Plastics Market
6.7.1. Middle East & Africa 3D Printing Plastics Market, by Country, 2016-2026 (USD Million)
6.7.2. Middle East & Africa 3D Printing Plastics Market, by Type, 2016-2026 (USD Million)
6.7.3. Middle East & Africa 3D Printing Plastics Market, by Form, 2016-2026 (USD Million)
6.7.4. Middle East & Africa 3D Printing Plastics Market, by Application, 2016-2026 (USD Million)
6.7.5. GCC 3D Printing Plastics Market, 2016-2026 (USD Million)
6.7.6. Rest of Middle East & Africa 3D Printing Plastics Market, 2016-2026 (USD Million)
Chapter 7 Competitive Intelligence
7.1. Top 5 Players Comparison
7.2. Market Positioning of Key Players, 2018
7.3. Market Players Mapping
7.3.1. By Type
7.3.2. By Form
7.3.3. By Application
7.3.4. By Region
7.4. Strategies Adopted by Key Market Players
7.5. Recent Developments in the Market
7.5.1. Mergers & Acquisitions, Partnership, New Product Developments
Chapter 8 Company Profiles
8.1. 3D Systems Corporation
8.1.1. 3D Systems Corporation Overview
8.1.2. 3D Systems Corporation Products Portfolio
8.1.3. 3D Systems Corporation Financial Overview
8.1.4. 3D Systems Corporation News/Recent Developments
8.2. Stratasys, Ltd
8.2.1. Stratasys, Ltd Overview
8.2.2. Stratasys, Ltd Products Portfolio
8.2.3. Stratasys, Ltd Financial Overview
8.2.4. Stratasys, Ltd News/Recent Developments
8.3. Arkema SA
8.3.1. Arkema SA Overview
8.3.2. Arkema SA Products Portfolio
8.3.3. Arkema SA Financial Overview
8.3.4. Arkema SA News/Recent Developments
8.4. BASF SE
8.4.1. BASF SE Overview
8.4.2. BASF SE Products Portfolio
8.4.3. BASF SE Financial Overview
8.4.4. BASF SE News/Recent Developments
8.5. Evonik Industries AG
8.5.1. Evonik Industries AG Overview
8.5.2. Evonik Industries AG Products Portfolio
8.5.3. Evonik Industries AG Financial Overview
8.5.4. Evonik Industries AG News/Recent Developments
8.6. SABIC
8.6.1. SABIC Overview
8.6.2. SABIC Products Portfolio
8.6.3. SABIC Financial Overview
8.6.4. SABIC News/Recent Developments
8.7. HP Inc.
8.7.1. HP Inc. Overview
8.7.2. HP Inc. Products Portfolio
8.7.3. HP Inc. Financial Overview
8.7.4. HP Inc. News/Recent Developments
8.8. DowDuPont Inc.
8.8.1. DowDuPont Inc. Overview
8.8.2. DowDuPont Inc. Products Portfolio
8.8.3. DowDuPont Inc. Financial Overview
8.8.4. DowDuPont Inc. News/Recent Developments
8.9. CRP Group
8.9.1. CRP Group Overview
8.9.2. CRP Group Products Portfolio
8.9.3. CRP Group Financial Overview
8.9.4. CRP Group News/Recent Developments
8.10. Envisiontec GmbH
8.10.1. Envisiontec GmbH Overview
8.10.2. Envisiontec GmbH Products Portfolio
8.10.3. Envisiontec GmbH Financial Overview
8.10.4. Envisiontec GmbH News/Recent Developments
Chapter 9 Preface
9.1. Data Triangulation
9.2. Research Methodology
9.2.1. Phase I – Secondary Research
9.2.2. Phase II – Primary Research
9.2.3. Phase III – Expert Panel Review
9.2.4. Approach Adopted
9.2.4.1. Top-Down Approach
9.2.4.2. Bottom-Up Approach
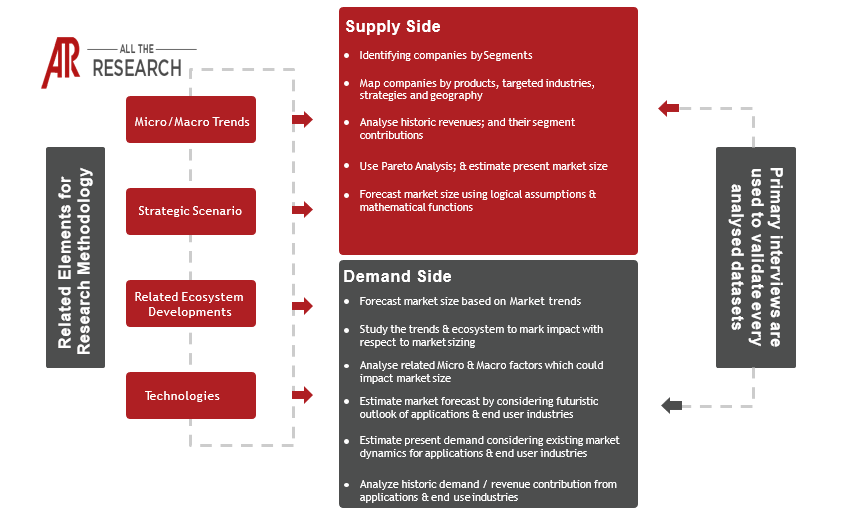
9.2.5. Supply- Demand side
9.2.6. Breakup of the Primary Profiles
